Skip to content
HES.
Contact Us
Solutions
Clean WaterControl pathogens, biofilm and cost where conventional treatment failsAir & Infection ControlReduce airborne pathogens and infection risk, with no ozoneHand Hygiene & Infection ControlEffective hand hygiene with the alcohol risks removed, where alcohol gel is a liabilityEnergyCut energy and recover it from the systems you already runRenewable ElectricityGenerate power from water flow you already treat, with no new infrastructureAgriculture & SoilUse less water and fertiliser while protecting yield and soil
Sectors
Healthcare & HospitalsKeep patients safe and your accreditation secure, with infection, Legionella and AMR risk reducedWater & WastewaterStay in consent, and cut the energy and chemicals it takes to get thereCommercial & FacilitiesMeet your EPC and disclosure obligations while running cost and carbon fallAgriculture & Urban FarmingProtect your yield and soil while using less water and fertiliserPoultry FarmingProve you control the water your birds drink, with biofilm and pathogens cleared and the evidence in handLocal AuthoritiesMove your estate towards net zero with compliant assets, funded to saveEmerging MarketsBuild investable, accreditation-ready infrastructure on reliable water, sanitation and powerHotels, Hospitality & LeisureKeep guests safe and pools open, with Legionella risk controlled and pool-hall cost cutData CentresCut the cost and water your cooling burns, and harden Legionella control, without touching uptimeFood & Beverage ProcessingCut your trade-effluent bill and hold consent, without touching food safety or uptimeMental HealthKeep the ward safe, with a hand-hygiene option that carries no ingestion, fire or ligature riskJustice & CustodyHand hygiene that is safe to issue inside the wing, where alcohol products are restrictedSocial CareProtect residents and carers, with hand hygiene that is safe to use and kind to skinEducationCut infection-driven absence with child-safe hand hygiene, at a defensible cost across the estate
Tools
Ask HESCase StudiesInsightsAbout
Contact Us
Solutions

Cut aeration costs and hit net zero 2030. No major capital works required.

Recover renewable electricity from the water you already treat.

Aeration is the single largest electricity load at your works. Phosphorus compliance is tightening automatically. Net Zero 2030 is binding. Recover renewable power from existing pressure and flow without major capital works, and achieve all three.

Aeration typically drives 50 to 90 percent of electricity spend and 15 to 49 percent of total operating cost. Energy recovery can achieve 20 to 50 percent aeration efficiency improvement combined with process optimisation.

The cost of inaction

Why aeration costs are your biggest controllable lever. And why the window to act is closing.

Aeration is the single largest electricity load at your works. Depending on your treatment process, it typically accounts for 50 to 90 percent of your total electricity consumption and 15 to 49 percent of your operating cost.

At a 100,000 PE works treating 10,000 m³ per day at typical electricity rates, aeration alone costs roughly 125,000 pounds per year. A 10 percent improvement in aeration efficiency is worth 12,500 pounds annually. Over a 3 to 5 year payback window, that is 37,500 to 62,500 pounds recaptured.

Phosphorus compliance is tightening automatically. The Defra Wastewater Treatment Plan sets statutory targets of 55 percent reduction from 2020 baseline by 31 December 2030, and 80 percent by 31 December 2038. Works that upgrade by 2030 will then face tighter permitted standards after 2030. If you miss the AMP8 upgrade window (ending March 2030), you will face both capex pressure and tighter permit standards simultaneously.

Net Zero 2030 is not optional. Water UK member companies committed in 2019 to net-zero operational carbon by 2030. Your energy consumption is the core lever. You cannot hit 2030 without aeration efficiency gains and on-site renewable generation.

How it works

How energy recovery from existing pressure and flow works

Renewable electricity is already hiding in your infrastructure. Every water treatment process moves large volumes of water. As that water flows, it carries kinetic energy.

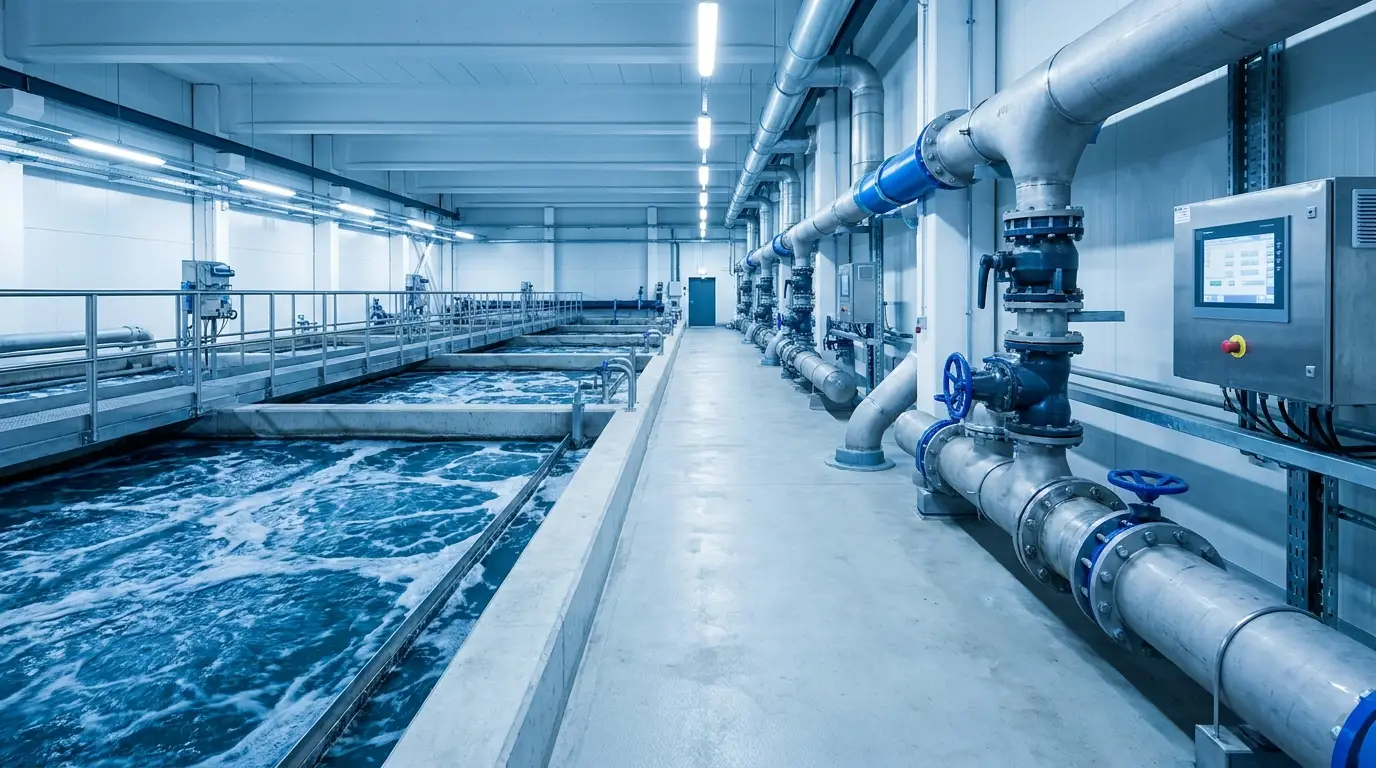
Pressure-reduction valves dissipate this energy as heat. Treatment discharge flows carry unused head. Energy recovery systems capture that flowing water inside existing pipes and convert its kinetic energy into electricity. The turbine sits submerged in the pipe, generates power continuously, and returns the water to its intended path. No external equipment. No civil works. No infrastructure disruption. The system operates 24 hours a day, 7 days a week, independent of weather or grid conditions.

For example: at a treatment works with a pressure-reduction valve dissipating 10 bar pressure drop across a 150mm pipe carrying 120 litres per second flow, that pressure and flow carry unused kinetic energy. A recovery system captures that energy and converts it to electricity continuously. The specific power output depends on your exact flow rate, head (pressure), and pipe diameter. This is assessed during your site survey.

What it delivers

What energy recovery delivers

Cost

Cut aeration electricity spend

Energy recovery from pressure reduction and discharge flows generates renewable electricity continuously. At a treatment works, aeration efficiency can improve 20 to 50 percent through optimised process control and on-site generation combined. Payback typically ranges from 3 to 8 years, depending on your baseline electricity rate and site conditions.

Obligation

Meet phosphorus compliance without major capital works

Phosphorus consent targets are tightening automatically post-2030. Energy recovery enables compliance-critical phosphorus removal systems without consuming your constrained capital budget. The pathway to compliance becomes feasible within your AMP8 totex envelope.

Obligation

Contribute to Net Zero 2030

Energy recovery from existing infrastructure delivers measurable, reportable carbon and energy reduction. It contributes directly to Water UK Net Zero 2030 pathway. Scope 1 operational emissions fall. Science-Based Targets progress.

Risk

Maintain operational resilience

On-site renewable generation reduces dependence on grid supply and price volatility. Continuous 24/7 operation (independent of weather, grid conditions, or supply interruptions) underpins operational continuity. Compliance exposure and penalty risk fall when energy-dependent treatment processes run reliably and efficiently.

Evidence

What the evidence shows

Regulatory drivers are clear and binding. Cost of inaction is measurable.

50 to 90%Aeration typically drives this share of electricity spend and 15 to 49 percent of total operating cost at a treatment works
55% reductionPhosphorus compliance target by 31 December 2030 (AMP8 deadline); permits tighten further to 80% reduction by 31 December 2038
20 to 50%Aeration efficiency improvement achievable through optimised process control and on-site generation combined
Reference sites

Results you can scrutinise

Regulatory drivers

Defra Wastewater Treatment Plan sets phosphorus tightening trajectory

55% reduction by 31 December 2030; 80% reduction by 31 December 2038. Works that upgrade by 2030 will then face tighter permitted standards, compounding capex and compliance pressure for those that delay.

Energy & Net Zero

Water UK Net Zero Routemap identifies energy recovery as core 2030 lever

Aeration efficiency and on-site renewable energy are explicitly named as pathways to achieve binding net-zero commitment. Ofwat AMP8 framework emphasises efficiency and lower-cost solutions before major civil works.

Operational

Energy recovery from existing pressure and flow is operationally proven

Peer-reviewed studies validate the mechanism and economics. Deployments are active in UK water treatment and utility networks. Magnitude and payback are site-specific and require assessment of your flow rate, head, pipe diameter, and duty cycle conditions.

Before you commit

Proven at full scale, with no disruption

The questions that matter most are whether it disrupts operations, whether the track record is proven, and what the payback is for your site.

On all three the answer is built in. The system sits inside existing pipework with no disruption to water flow. Installation requires no major civil works or infrastructure changes. Maintenance aligns with your existing schedules with minimal incremental burden. The specific power output and payback are site-specific and require a technical site assessment using your actual infrastructure data.

Assessment is non-invasive and typically takes 2 to 4 weeks. Most operations teams move forward because the numbers are compelling and the integration is straightforward.
Questions answered
Will this disrupt operations during installation?

No. The system sits inside existing pipework. Installation does not interrupt water flow or require major civil works. The retrofit integrates into your existing infrastructure at pressure-reduction stations, discharge points, or other high-flow locations you identify. Your treatment processes continue without interruption.

What is the track record? Has this worked at similar-scale treatment works?

Energy recovery from existing water flow is operationally proven and peer-reviewed. The specific outcome for your site depends on your flow rate, head, pipe diameter, and continuous duty cycle. A technical site assessment quantifies the potential at your works, using your actual infrastructure data.

What happens to maintenance? Will this add to our workload?

Maintenance aligns with your existing schedules. The system is designed for minimal incremental burden. Full operator training and technical support are included. Your team receives guidance on integration into your compliance and maintenance regime.

What is the envelope? What flows, pressures, and pipe sizes do you support?

Optimal envelope: 70 to 200 litres per second flow, 3 to 10 metres of head, 8 to 24 inch pipes. Custom configurations beyond this range are assessed on a site-by-site basis. Your technical site assessment determines whether your infrastructure fits, and quantifies power output and payback accordingly.

How long is the payback?

Payback typically ranges from 3 to 8 years, depending on your baseline electricity rate, your site's flow and head conditions, and the power output achievable. Your site assessment provides a specific payback figure based on your infrastructure and operational profile.

How does this support our regulatory obligations?

Energy recovery contributes to Obligation drivers directly. It helps you achieve Net Zero 2030 energy targets (Water UK commitment), supports phosphorus compliance without major capital works (Defra Wastewater Treatment Plan 2030 deadline), and reduces operational cost (AMP8 totex efficiency requirement).

Ready to understand your potential?

The next step is straightforward: a technical site assessment. We evaluate your actual flow rates, pressure levels, pipe diameters, and duty cycles. From that, we quantify the potential energy recovery, the cost savings, the payback timeline, and the regulatory contribution specific to your works.

Request a site assessment
Speak to the Team

Tell us your challenge

Tell us the cost, the risk or the obligation you are facing. A senior member of our team will respond, in confidence, with how we would help.

Every enquiry is handled in strict confidence.